Over the winter I decided to switch from my homemade digital dashboard solution to the Autosport Labs RaceCapture Pro.
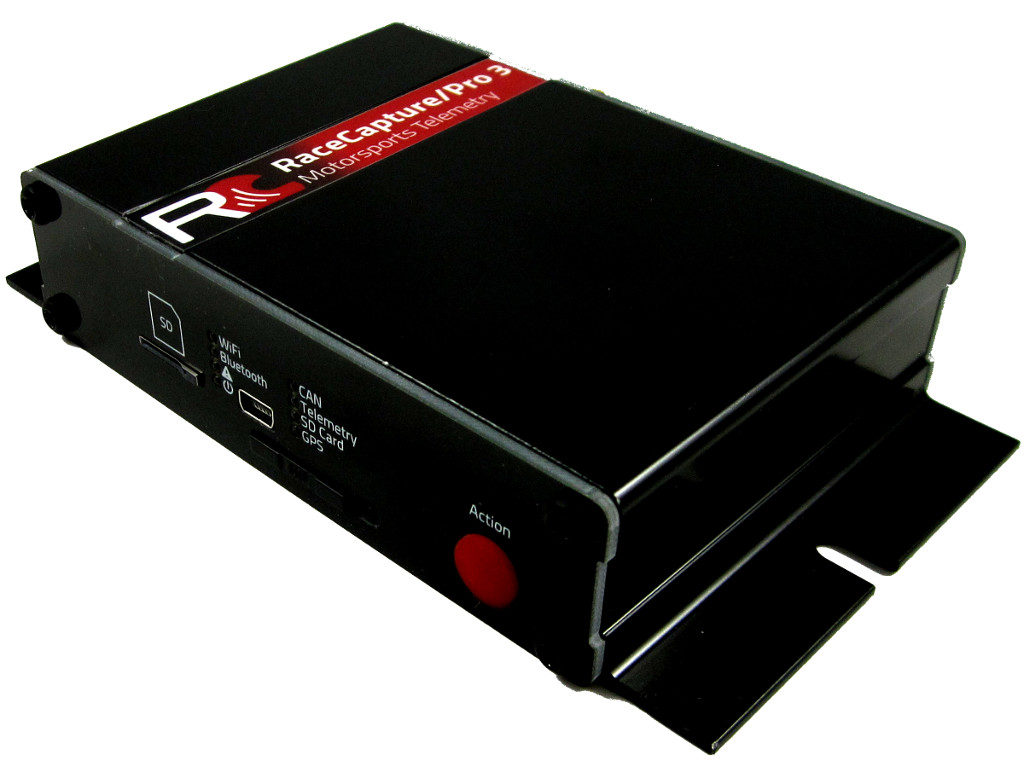
In terms of logging hardware, it includes a ton of features:
- 8 12bit analog inputs
- 3 digital I/O
- 4 timer inputs
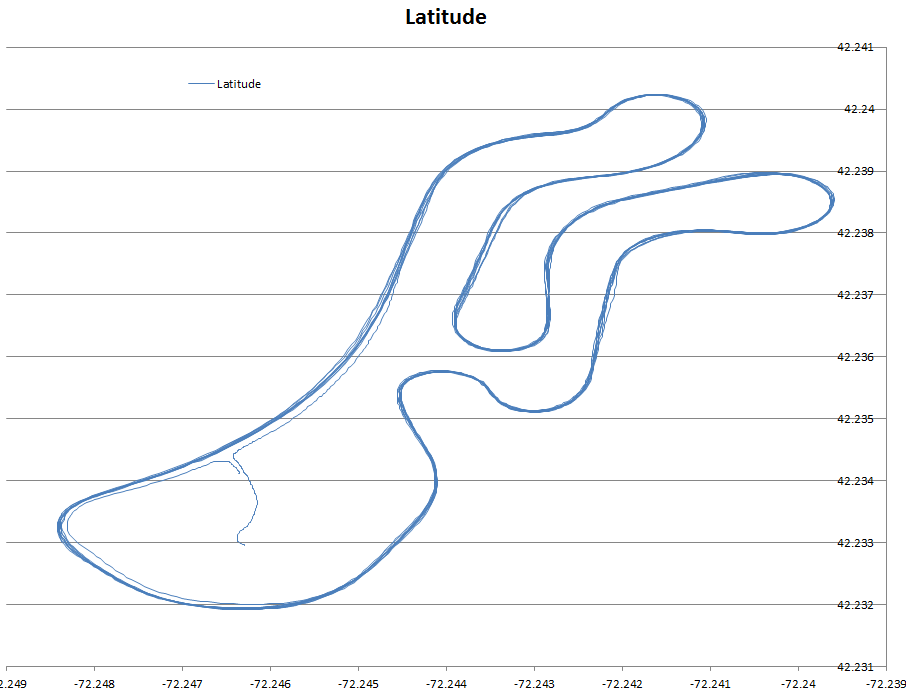
- 10Hz GPS
- 3-axis accelerometer
- 2 CANBUS busses
- RS-232
- WiFi
- Bluetooth
- SD card storage
The other cool thing is that its designed for you to use a tablet as the dashboard display. The tablet connects to the main unit via bluetooth and looks something like this:

There are many configuration options and you can have as many “screens” as you want so you can cycle through different displays as needed.
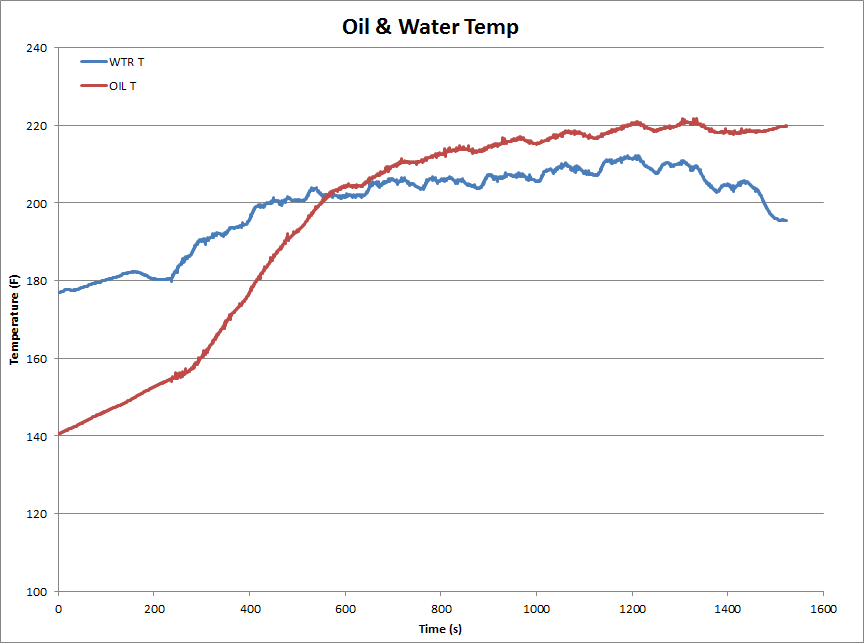
In terms of software, the RaceCapture app can be run on a PC or even on the tablet itself. The idea is that after a session, you can pull out the dashboard tablet and check out the data. You can plot channels and compare laps.
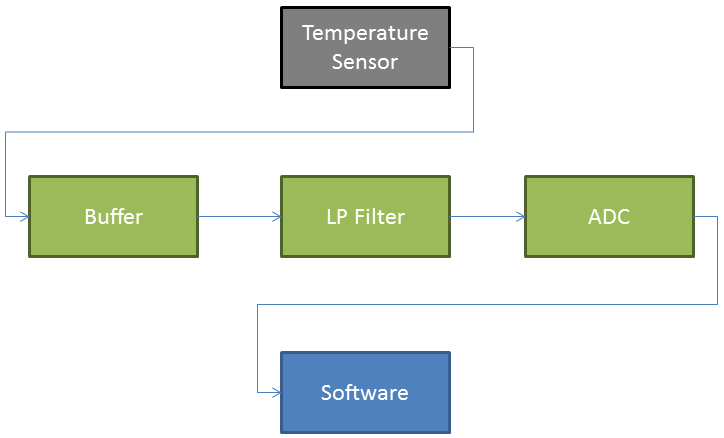
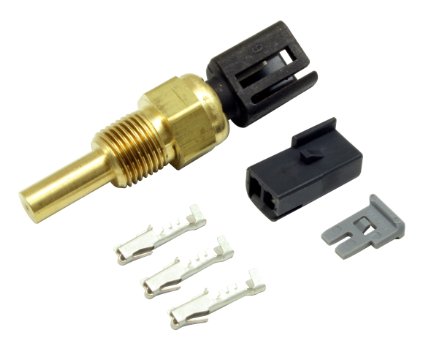
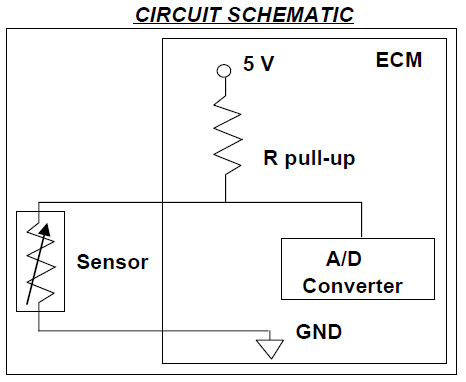
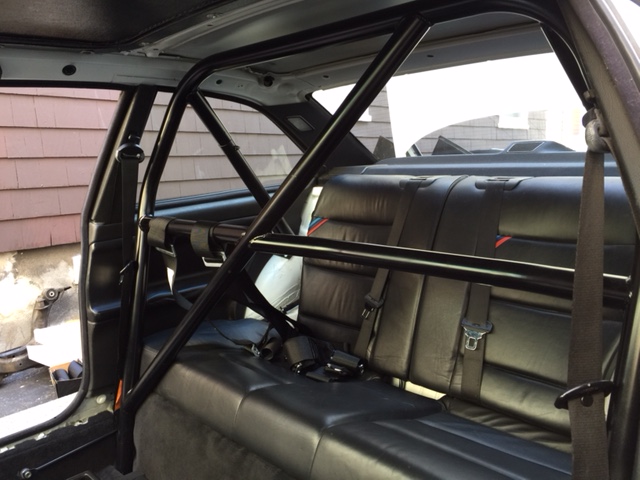
I ended up using the RaceCapture Pro mk3 connected to my water temp, oil temp, oil pressure, and TPS sensors. I used an Amazon Fire HD8 tablet as the dash as you can see here:
The RCP system uses LUA scripting to configure much of the hardware and also to allow you to write custom vitual channel scripts. Here is the LUA script i wrote to setup my hardware as well as the ShiftX2 shift light. It also calculates speed based off of the E36’s differential speed sensor and gear based on speed and RPM.
setTickRate(10) --10Hz
-- What CAN bus ShiftX2 is connected to. 0=CAN1, 1=CAN2
sxCan = 1
-- 0=first ShiftX2 on bus, 1=second ShiftX2 (if ADR1 jumper is cut)
sxId=0
--Brightness, 0-100. 0=automatic brightness
sxBright=0
sxCanId = 0xE3600 + (256 * sxId)
println('shiftx2 base id ' ..sxCanId)
--virtual channels
--addChannel("name",SR,prec,min,max,"unit")
speeddiff_id = addChannel("Speed_",10,0,0,160,"MPH")
gear_id = addChannel("Gear",5,0,0,5,"gear")
brakeg_id = addChannel("BrakeG",10,2,0,2,"G")
--global constants
first = 4.20
second = 2.49
third = 1.66
fourth = 1.24
fifth = 1.00
final = 3.46
tirediameter = 24.7
--global variables
rpm = 0
rpm_diff = 0
speed = 0
function updateSpeedDiff()
   rpm_diff = getTimerRpm(1)
   speed = rpm_difftirediameter0.002975
   speed = speed + 0.5 -- round because 0 prec. truncates
   setChannel(speeddiff_id, speed)
end
function updateGear()
   rpm = getTimerRpm(0)
   local gearErr = 0.15
   local gear = 0
if speed > 2 then
      ratio = rpm/(rpm_diff*final)
      if ((first  - ratio)^2) < (gearErr^2) then gear = 1 end
      if ((second - ratio)^2) < (gearErr^2) then gear = 2 end
      if ((third  - ratio)^2) < (gearErr^2) then gear = 3 end
      if ((fourth - ratio)^2) < (gearErr^2) then gear = 4 end
      if ((fifth  - ratio)^2) < (gearErr^2) then gear = 5 end
   end
   setChannel(gear_id, gear)
end
function autoLog()
   if speed > 10 and rpm > 500 then
      startLogging()
   end
   if speed < 5 and rpm < 100 then
      stopLogging()
   end
end
function sxOnUpdate()
  --add your code to update ShiftX2 alerts or linear graph during run time.
  --Runs continuously based on tickRate.
--uncomment the below for Direct RPM on input 0
  sxUpdateLinearGraph(getTimerRpm(0))
--update engine temp alert
  sxUpdateAlert(0, getAnalog(0))
--update oil pressure alert
  sxUpdateAlert(1, getAnalog(2))
end
function sxOnInit()
  --config shift light
  sxCfgLinearGraph(0,0,0,7000) --left to right graph, linear style, 0 - 7000 RPM range
sxSetLinearThresh(0,0,4000,0,255,0,0) --green at 3000 RPM
  sxSetLinearThresh(1,0,5400,255,255,0,0) --yellow at 5000 RPM
  sxSetLinearThresh(2,0,6800,255,0,0,10) --red+flash at 6500 RPM
--configure first alert (right LED) as engine temperature (F)
  sxSetAlertThresh(0,0,215,255,255,0,5) --yellow warning at 215F
  sxSetAlertThresh(0,1,225,255,0,0,10) -- red flash at 225F
--configure second alert (left LED) as oil pressure (PSI)
  sxSetAlertThresh(1,0,0,255,0,0,10) --red flash below 8 psi
  sxSetAlertThresh(1,1,8,255,255,0,5) --yellow flash 8-12 PSI
  sxSetAlertThresh(1,2,12,0,0,0,0) --above 12, no alert
end
function sxOnBut(b)
  --called if the button state changes
  println('button: ' ..b)
end
---ShiftX2 functions
function sxSetLed(i,l,r,g,b,f)
  sxTx(10,{i,l,r,g,b,f})
end
function sxSetLinearThresh(id,s,th,r,g,b,f)
  sxTx(41,{id,s,spl(th),sph(th),r,g,b,f})
end
function sxSetAlertThresh(id,tid,th,r,g,b,f)
  sxTx(21,{id,tid,spl(th),sph(th),r,g,b,f})
end
function setBaseConfig(bright)
  sxTx(3,{bright})
end
function sxSetAlert(id,r,g,b,f)
  sxTx(20,{id,r,g,b,f})
end
function sxUpdateAlert(id,v)
  if v~=nil then sxTx(22,{id,spl(v),sph(v)}) end
end
function sxCfgLinearGraph(rs,ls,lr,hr)
  sxTx(40,{rs,ls,spl(lr),sph(lr),spl(hr),sph(hr)})
end
function sxUpdateLinearGraph(v)
  if v ~= nil then sxTx(42,{spl(v),sph(v)}) end
end
function sxInit()
  println('config shiftX2')
  setBaseConfig(sxBright)
  if sxOnInit~=nil then sxOnInit() end
end
function sxChkCan()
  id,ext,data=rxCAN(sxCan,0)
  if id==sxCanId then sxInit() end
  if id==sxCanId+60 and sxOnBut~=nil then sxOnBut(data[1]) end
end
function sxProcess()
  sxChkCan()
  if sxOnUpdate~=nil then sxOnUpdate() end
end
function sxTx(offset, data)
  txCAN(sxCan, sxCanId + offset, 1, data)
  sleep(10)
end
function spl(v) return bit.band(v,0xFF) end
function sph(v) return bit.rshift(bit.band(v,0xFF00),8) end
function onTick()
  updateSpeedDiff()
  updateGear()
  autoLog()
  sxProcess()
end
sxInit()
See my latest RaceCapture LUA scripts on my Github.